6. Creating a Visualization
The platform offers several methods of generating a new visualization from a data view.
You can create a new visualization by placing your mouse over the Visualization button from the main menu and clicking on New. This action will launch an internal lightbox from where you can choose the data view you want to use to generate the new visualization.
Additionally, you may generate a new visualization directly from any data view. You can either place your mouse over the data view you want to use, then from the Data Views menu select Create Visualization and follow the prompts. You can also click on the data view’s title to go into the Data Views page, and then on the Create Visualization button on the upper right side on your screen.
Once you have followed the process correctly, the platform will launch the wizard to create a visualization. Select the type of visualization you want to create. You may generate charts and maps depending on the data you have.
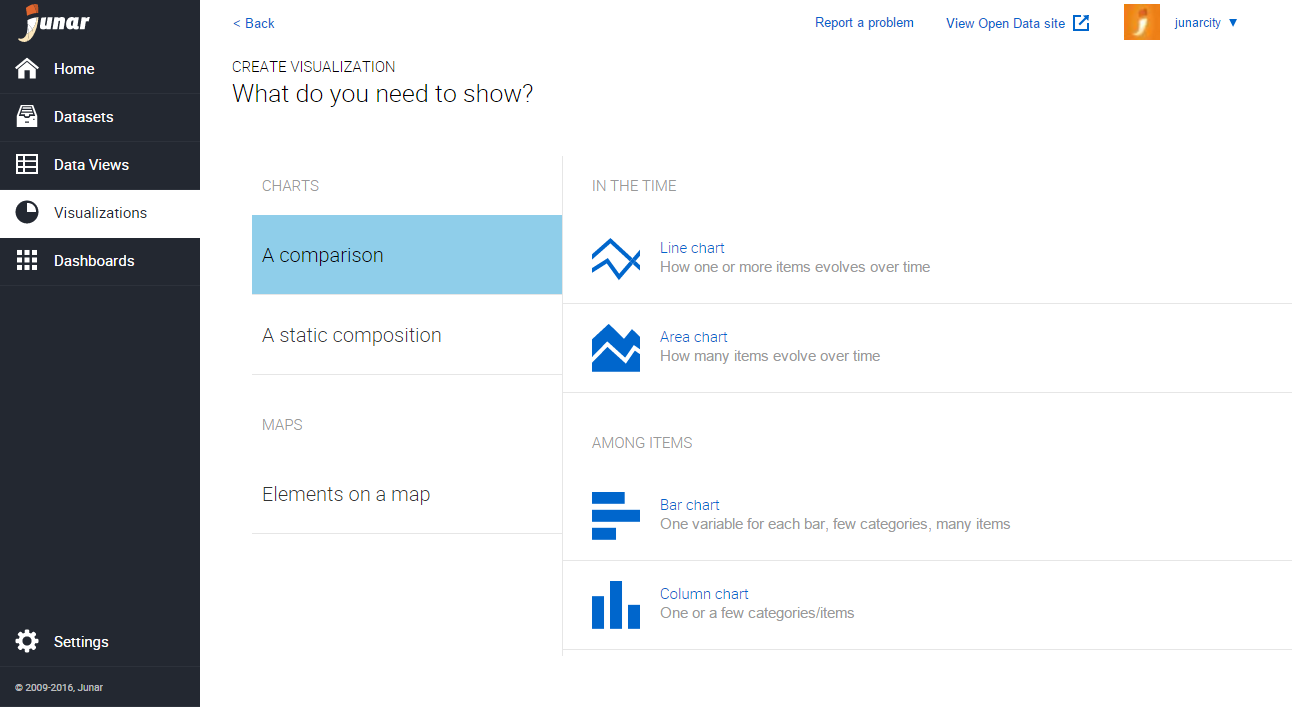
Click on the the type of chart you want to create.
You may choose a chart for a Comparison In Time (Line chart and Area chart) or a Comparison Among Items (Bar chart and Column chart), Static Composition (Pie chart) or Elements on a Map to create a map.
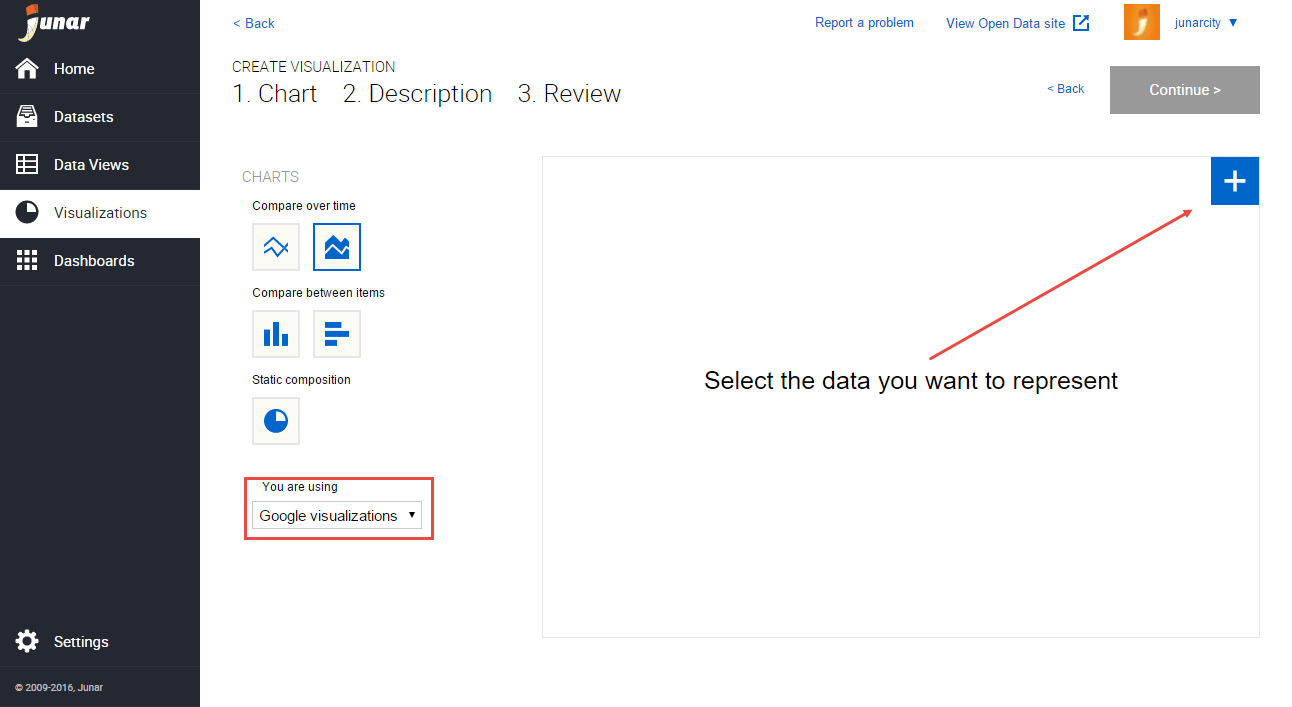
Next, click on the ![]() button to add the data you want to represent. Please also note that you will be using the Google’s chart library by default, but you may switch to the D3 library by clicking on the drop-down and clicking on D3.
button to add the data you want to represent. Please also note that you will be using the Google’s chart library by default, but you may switch to the D3 library by clicking on the drop-down and clicking on D3.
You will need to define the Data Intervals, Labels, and Legends by clicking on each and selecting the range of cells pertaining to each field.
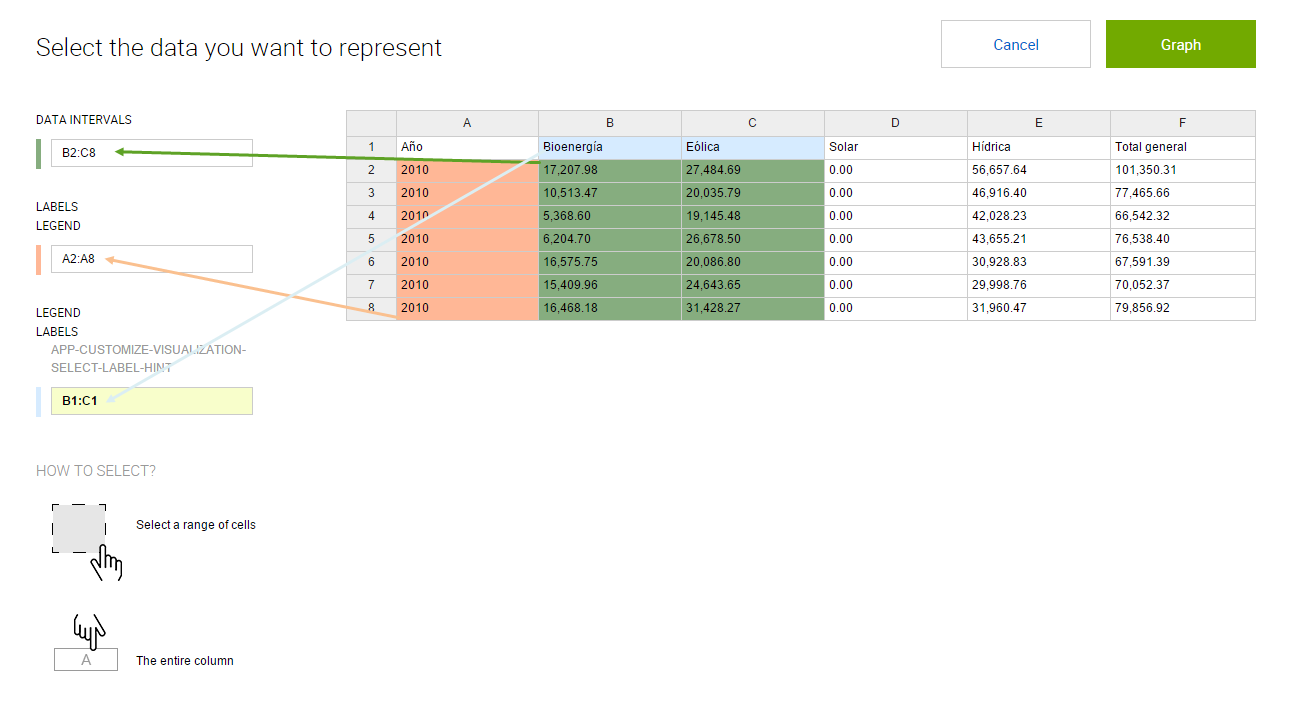
Then click on Graph to generate the new visualization.
Once you are done making changes to the new visualization, click on Continue to add a Title, Description, and Other Metadata. When finished, click on Continue for a final review. If you are happy with the result, click on Save. The new visualization will be saved as a Draft, and you can now publish it to the Open Data microsite.
6.1 Editing and Deleting Visualizations
To edit/delete a visualization, please go to the Visualizations page by clicking on the Visualization button from the main menu on the left. Place your mouse over the visualization’s title in the list and the editing menu will be displayed. Click on Edit or Delete.
- Edit: When selecting this option, the user is able to update the visualization’s information.
- Delete: When selecting this option, the user is able to delete the recent changes or all changes made to the visualization.
- View Data View: When selecting this option, the user accesses the original data view.
You may also click on the visualization’s title to go into its information section, then click on the options menu [ … ] located on the upper right part of your screen. From the drop down menu, click on Edit or Delete.
6.2 Publishing a Visualization
To publish a visualization, the associated data view must be published. By default, all new visualizations will be saved as drafts. If the visualization is under review, it must first be accepted to be published. To publish a visualization to the Open Data microsite, click on the visualization of interest and then the Publish button in the upper right section.
